Observability 101: Metrics, Logs & Traces Explained
Gain full visibility into your systems and resolve issues faster with observability.

Introduction
As software architectures split into microservices, locating the exact source of an API failure becomes complex.
Observability solves this by logging detailed inputs, mapping trace paths, and tracking metrics continuously.
The Shift from Monitoring to Observability
Monitoring notifies you when systems break down. Observability helps you discover *why* they failed, letting you query unknown system behaviors.
- Locating slow database queries that degrade web responses.
- Correlating server CPU alerts to code commits.
- Tracing memory leaks back to specific container nodes.
“ Monitoring is for checking system inputs and outputs; observability is for diagnosing the internal code states. ”
The Three Pillars of Modern Observability
Structure your application logging frameworks around these telemetry fields.
Monitor quantitative statistics like CPU utilization, error percentages, and latency averages. Use metrics to trigger system alarms.
METRICS TIP: Focus on the golden signals: Latency, Traffic, Errors, and Saturation.
Structured, timestamped outputs of execution events. Logs explain *what* happened inside container stacks during anomalies.
BEST PRACTICE: Output logs as structured JSON to allow engines to index and query them efficiently.
Tools That Make a Difference
Use these cloud-native tracing frameworks to monitor platforms.
Key Takeaways
Key Takeaways
- Collect metrics to monitor general server performance and warning alarms
- Structure logs in JSON to allow index parser querying across nodes
- Correlate trace IDs to track request latencies across network hops
- Build unified dashboards showing metrics, traces, and logs together
Conclusion
Deploying unified telemetry frameworks enables support teams to diagnose errors in minutes rather than hours, maintaining target SLAs.
Privia integrates OpenTelemetry collectors and configures custom Grafana stacks. Contact us to audit your systems.
Continue Reading
View All Posts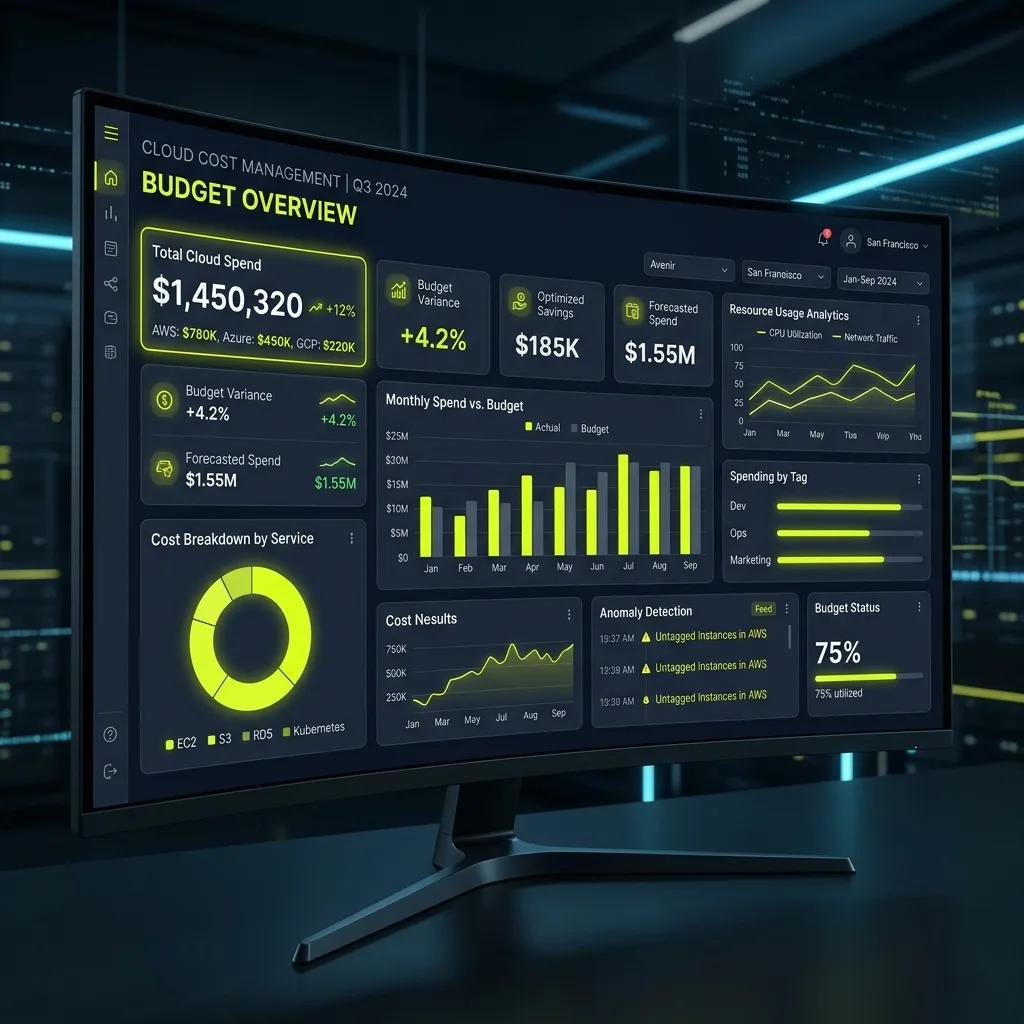 Cloud / SRE
Cloud Cost Guardrails: Stop Runaway Spending
Implement proactive cost controls and prevent cloud bill surprises with these proven strategies.
 DevOps
Shift Security Left: A Practical DevSecOps Roadmap
Integrate security early in your CI/CD pipeline to build safer applications, faster.
Cloud / SREKubernetes Resource Optimization Cheat Sheet
Reduce waste and improve performance with these battle-tested Kubernetes tips.